
How to use exponential moving averages to read gold’s trends, time entries, and manage risk
Gold is a market of strong personalities. It trends for weeks when inflation fears, central bank buying, or geopolitical stress take hold, then snaps into choppy ranges when the macro story goes quiet. It reacts sharply to interest rate expectations, the U.S. dollar, and real yields. For a trader, that mix of long trends and sudden volatility makes one tool especially useful: the exponential moving average, or EMA.
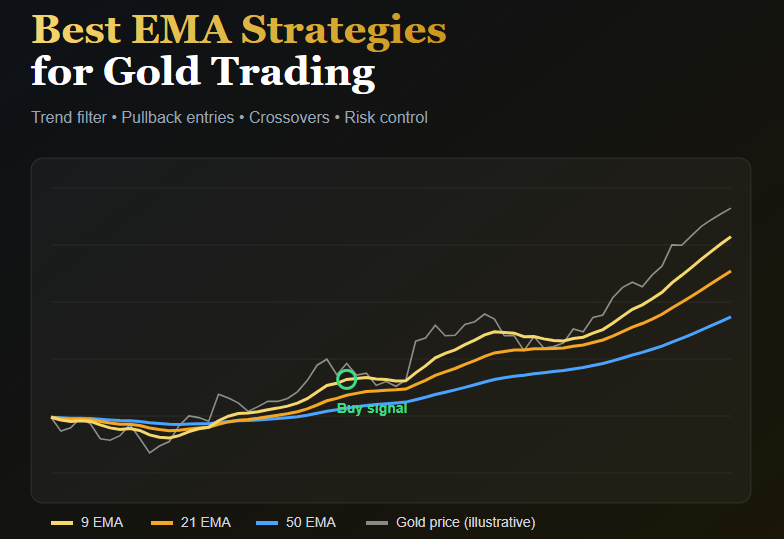
This article covers what makes the EMA a good fit for gold, which settings tend to work, and five practical strategies you can test. It also covers the mistakes that cost traders money, because the indicator is only as good as the discipline behind it.
Why the EMA Suits Gold
A moving average smooths price into a single line so you can see direction without the noise of every candle. The simple moving average (SMA) weights every period equally. The EMA gives more weight to recent prices, so it reacts faster when momentum shifts.
That speed matters in gold for two reasons. First, gold often moves in sharp bursts around events such as U.S. inflation data, Federal Reserve meetings, and employment reports. A slower average can lag badly after a spike, leaving you late to both entries and exits. Second, gold tends to respect dynamic levels. On trending days you will often see price pull back to a rising EMA, pause, and continue. Traders watch the same lines, which makes those reactions somewhat self-reinforcing.
The tradeoff is that faster also means noisier. An EMA will whipsaw in a sideways market, producing crossovers that fail almost immediately. Most of the craft in EMA trading is knowing when to trust the signal and when to stand aside.
Choosing Your EMA Settings
There is no magic number, but some settings are popular for good reason, because many traders act on them.
- 9 and 21 EMA: Fast pair for scalping and short-term intraday trading on the 5-minute to 15-minute charts.
- 20 and 50 EMA: A balanced pair for swing and day trading on the 1-hour and 4-hour charts.
- 50 and 200 EMA: The classic long-term pair for identifying the primary trend on the 4-hour, daily, and weekly charts.
- 8, 13, and 21 EMA (a ribbon): Often used with a Fibonacci flavor to gauge trend strength through how the lines fan out or compress.
A useful rule is to match the EMA to your holding period. If you hold trades for a few hours, a 200 EMA on the 15-minute chart is mostly irrelevant; the 20 and 50 on the hourly chart will tell you more. Pick one family of settings, learn how gold behaves around them, and resist the urge to keep changing numbers after every losing trade.
Strategy 1: The Trend-Filter Pullback
This is the most reliable approach for most gold traders because it trades with the dominant trend instead of guessing tops and bottoms.
Setup: Use the 50 EMA and 200 EMA on the 4-hour chart to define the trend. If the 50 is above the 200 and both are sloping upward, you only look for buys. If the 50 is below the 200 and both slope down, you only look for sells.
Entry: Drop to the 1-hour chart and wait for price to pull back to the 20 or 50 EMA. Look for a confirming candle, such as a bullish engulfing candle or a pin bar with a long lower wick for a buy. Enter when that candle closes or on a break of its high.
Stop loss: Place it just beyond the pullback low (for buys), or below the 50 EMA with a small buffer for volatility. Gold’s wicks can be violent, so give the trade room rather than placing the stop exactly on the line.
Target: Aim for the previous swing high or a fixed risk-to-reward of at least 1:2.
The key discipline here is patience. You are waiting for price to come to you. Chasing a breakout far from the EMA gives you a wide stop and poor reward-to-risk.
Strategy 2: The EMA Crossover with a Trend Filter
The crossover is the best-known EMA strategy and also the most abused. Used on its own, it generates many false signals in ranging markets. Used with a filter, it becomes much more useful.
Setup: Use a 9 EMA and 21 EMA on the 15-minute or 1-hour chart. Add a 200 EMA as a directional filter.
Entry: Take a buy when the 9 crosses above the 21 and price is above the 200 EMA. Take a sell when the 9 crosses below the 21 and price is below the 200 EMA. Ignore every crossover that goes against the 200.
Exit: Close the trade when the 9 crosses back through the 21, or use a trailing stop beneath each new swing low (for buys).
This filter removes roughly half of the signals, and typically the worst half. You will still take losses, but they tend to be smaller than the winners during real trends.
Strategy 3: The EMA Ribbon for Trend Strength
A ribbon uses several EMAs, such as 8, 13, 21, 34, and 55, plotted together. The spacing between the lines tells you about the trend’s health.
When the lines are stacked in order and spreading apart, momentum is strong and pullbacks are likely to be shallow. When they bunch together and tangle, the trend is losing steam or the market is ranging.
How to trade it: Enter on a pullback to the 13 or 21 EMA while the ribbon is fanned out and ordered. Exit or tighten stops when the ribbon begins to compress and price closes through the 34 EMA. This approach shines during gold’s powerful rallies, such as those driven by safe-haven demand, because it keeps you in the move rather than tempting you to exit early.
Its weakness is that compressed ribbons produce confusing signals. Treat a tangled ribbon as a signal to step aside, not a puzzle to solve.
Strategy 4: The Dynamic Support and Resistance Bounce
Gold often treats certain EMAs as a floor in uptrends and a ceiling in downtrends. On the daily chart, the 50 EMA and 200 EMA are frequently watched by institutions and swing traders, and bounces from these lines can be significant.
Setup: On the daily or 4-hour chart, identify a clear trend and mark where price has previously reacted to the 50 or 200 EMA.
Entry: When price returns to the EMA, wait for a rejection signal before entering. That might be a long wick, an engulfing candle, or a lower-timeframe break of structure. Never buy simply because price touched a line; touching is not confirming.
Risk management: If price closes decisively beyond the 200 EMA, the thesis is likely broken. Accept the loss and move on. A common mistake is to hold on hoping the line will hold the second or third time.
Strategy 5: Multi-Timeframe Confirmation
Professional-looking results often come from simple alignment. Use three timeframes, each with a job:
- Daily chart: Determines the bias with the 50 and 200 EMA.
- 4-hour chart: Identifies the pullback zone near the 20 or 50 EMA.
- 15-minute or 1-hour chart: Provides the precise entry trigger, such as a 9/21 EMA crossover back in the trend’s direction.
If all three agree, the trade has the market’s weight behind it. If the daily is bullish but the 4-hour is bearish, you either wait or accept that you are taking a lower-probability counter-trend trade, and size down accordingly.
Risk Management Matters More Than the Indicator
No EMA strategy survives poor risk control, and gold is unforgiving to oversized positions.
- Risk a small, fixed percentage per trade, commonly 0.5% to 1% of your account. Gold can move several dollars in seconds, and leverage magnifies the damage.
- Use ATR to set stops. The Average True Range tells you how much gold is actually moving. A stop of roughly 1.5 times ATR beyond your reference point adapts to quiet and volatile conditions alike.
- Respect the news calendar. Major U.S. data releases and Fed announcements can blow through EMAs instantly. Many traders avoid entering just before these events, or reduce size.
- Watch the session. Gold is most active during the London and New York overlap. Moves in the quiet Asian session are often slower and prone to false breakouts at the EMAs.
- Track your results. Keep a journal. If a setup does not work over 50 to 100 trades, change something deliberately, not emotionally.
Common Mistakes to Avoid
Trading every crossover. Most crossovers in a range are noise. Use a trend filter or volatility check.
Using too many indicators. An EMA plus one momentum tool such as RSI is plenty. Piling on indicators creates conflicting signals and hesitation.
Ignoring the market context. Gold responds to real yields, the dollar, and risk sentiment. If the EMA says buy but the dollar is surging on a hot jobs report, think twice.
Chasing price away from the average. The further price stretches from the EMA, the more likely a pullback becomes. Late entries produce poor reward-to-risk.
Skipping the backtest. Test any strategy on historical gold data and then on a demo account before risking real money. Gold’s behavior has varied across years, so check performance across both trending and ranging periods.
Putting It Together
A sensible starting framework looks like this: use the daily 50 and 200 EMA to set your bias, wait for a pullback to the 4-hour or hourly 20 or 50 EMA, and trigger the entry with a confirming candle or a fast EMA crossover. Place your stop beyond the swing point with an ATR buffer, target at least twice your risk, and trail the stop with the 21 EMA as the trade matures. Stand aside when EMAs are flat, tangled, or price is chopping across them.
The EMA will not predict gold’s next move. What it does is give you a structured, repeatable way to identify trend, find sensible entries, and define where you are wrong. Combined with strict risk control and patience, that structure is often what separates consistent traders from those who simply react to every spike.
Disclaimer: This article is for educational purposes only and is not financial advice. Trading gold, especially with leverage, carries a high risk of loss. Test any strategy on a demo account first and consider speaking with a licensed financial advisor.