
Prop firm challenges look simple: hit a profit target, stay inside the drawdown limits, get funded. Yet most traders fail. The reason usually isn’t a bad strategy. It’s that they never did the math on how a challenge works.
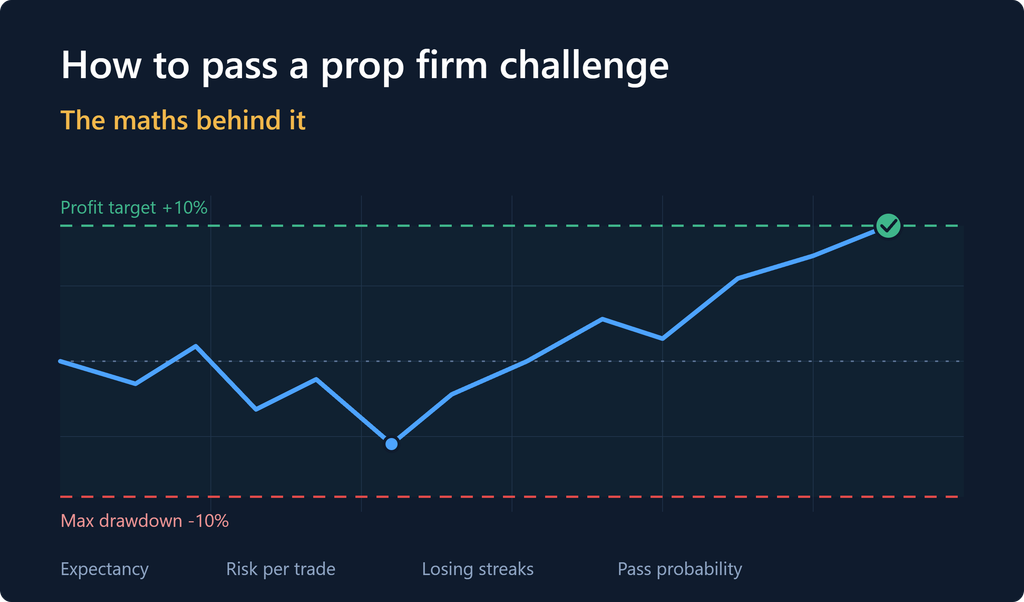
A challenge is a probability problem with two boundaries: a profit target above you and a drawdown limit below you. Your job is to reach the top before touching the bottom. This guide breaks that down with real numbers.
This is educational content, not financial advice. Trading carries a real risk of loss.
1. How a Typical Challenge Works
Rules vary by firm, but most look like this [VERIFY against the specific firm]:
Also read: Best 5 Top Funded Trading Firms
| Rule | Typical value |
|---|---|
| Account size | $10,000 to $200,000 |
| Phase 1 profit target | 8% to 10% |
| Phase 2 profit target | 5% |
| Max daily loss | 4% to 5% |
| Max total drawdown | 8% to 12% |
| Time limit | 30 days, or none |
| Minimum trading days | 4 to 5 |
We’ll use a simple model for the examples below: a $100,000 account, 10% target, 10% max drawdown, 5% daily loss limit.
2. Step One: Know Your Expectancy
Before anything else, you need to know whether your strategy makes money over many trades. The formula is:
Expectancy (in R) = (Win rate × Average win) − (Loss rate × Average loss)
Here R is your risk per trade. If you risk $500 and lose, that’s −1R. If you win $1,000, that’s +2R.
Example A: 40% win rate, average win 2R, average loss 1R
- (0.40 × 2) − (0.60 × 1) = 0.80 − 0.60 = +0.20R per trade
Example B: 55% win rate, average win 1R, average loss 1R
- (0.55 × 1) − (0.45 × 1) = +0.10R per trade
Example C: 45% win rate, 1R wins, 1R losses
- (0.45 × 1) − (0.55 × 1) = −0.10R per trade
Example C will lose money no matter how you size it. No money management trick turns a negative expectancy into a profitable one. If your strategy hasn’t been tested on at least 100 to 200 trades, you don’t yet know your expectancy.
Key point: Win rate alone means nothing. A 40% win rate with 2:1 reward-to-risk beats a 55% win rate with 1:1 payoffs.
3. The Core Maths: Reaching the Target Before the Drawdown
Treat each trade as a step in a random walk. Win and you move up by your reward, lose and you move down by your risk. The question is the probability of hitting +10% before −10%.
This is the classic gambler’s ruin problem. For a strategy with 1:1 payoffs, win probability p and loss probability q = 1 − p, the chance of reaching the target is:
P(pass) = (1 − r^i) / (1 − r^N), where r = q/p
Here N is the total distance between the two boundaries measured in units of risk per trade, and i is how far you are from the bottom boundary.
Let’s use 1% risk per trade, so the target is +10 units and the drawdown limit is −10 units. That gives N = 20 and i = 10.
| Win rate (1:1 payoff) | Chance of hitting +10% before −10% |
|---|---|
| 45% | about 12% |
| 50% | 50% |
| 55% | about 88% |
| 60% | about 98% |
Look at how sharply this moves. A 5-point change in win rate swings your pass probability from 12% to 50% to 88%. A small edge, applied consistently with enough room to survive, compounds into a high pass rate. A small negative edge almost guarantees failure.
(The 50% row is the symmetric case: when win and loss are equal, the probability of reaching either boundary first is simply the distance ratio, 10 ÷ 20.)
4. Position Sizing: The Biggest Lever You Control
The drawdown limit doesn’t change, but you control how many “units” of room you have by choosing risk per trade.
- Risk 2% per trade: a 10% drawdown is only 5 losing trades deep.
- Risk 1%: it’s 10 losing trades deep.
- Risk 0.5%: it’s 20 losing trades deep.
Take the 55% win rate, 1:1 payoff strategy again, and compare risk levels:
| Risk per trade | Distance to target / drawdown (units) | Approx. pass probability | Approx. trades needed |
|---|---|---|---|
| 2% | 5 / 5 | about 73% | ~50 |
| 1% | 10 / 10 | about 88% | ~100 |
| 0.5% | 20 / 20 | about 98% | ~200 |
The pattern is clear. Lower risk raises your pass probability but needs more trades and more time. That tradeoff is the heart of challenge strategy:
- If your firm has no time limit, risk less and let your edge play out.
- If there’s a 30-day limit, you must balance risk against the trade count you can realistically take. Pushing risk up to “finish quickly” is exactly how most accounts get blown.
For most traders with a modest edge, 0.5% to 1% per trade is the practical range.
5. Why Kelly Is Dangerous Here
The Kelly criterion gives the “optimal” bet size for growth:
Kelly % = p − (q / b), where b is your reward-to-risk ratio.
With a 50% win rate and 2:1 payoff, Kelly says to risk 25% per trade. Obviously you can’t do that with a 10% drawdown limit. Even half-Kelly or quarter-Kelly would blow most challenge accounts quickly, because Kelly assumes you can tolerate huge swings and have a perfectly known edge. Your estimated edge is always uncertain, so real-world sizing should be a small fraction of Kelly. Challenge rules push that fraction lower still.
6. Streaks: The Maths of Losing Runs
Even a profitable strategy produces losing streaks, and the drawdown rule punishes them. The chance of n losses in a row is q^n, but over a full challenge the cumulative odds are much higher than people expect.
Over a 100-trade sample:
- With a 50% win rate, there’s roughly a 30% chance of seeing a losing streak of 7 or more at some point.
- With a 60% win rate, there’s roughly a 40% to 45% chance of seeing a streak of 5 or more.
Now connect that to risk. At 1% risk, a 7-loss streak costs about 7%. Fine. At 2% risk, the same streak costs about 14%, and the account is gone. You should size your trades assuming a streak will happen, not hoping it won’t.
A useful rule: choose a risk level where your plausible worst streak (say, 8 to 10 losses) still leaves you above the drawdown limit with room to recover.
7. The Daily Loss Limit
The daily limit is the rule that quietly ends more challenges than the overall drawdown. With a 5% daily limit:
- At 1% risk, five consecutive losses in one day breach it. That’s unlikely, but possible if you revenge trade.
- At 2% risk, three losses plus slippage can get you uncomfortably close.
Also check how the firm calculates it. Some use balance, some use equity (including floating losses), and some reset at a specific server time [VERIFY]. Open trades with large floating drawdown can breach the limit even if you never close at a loss.
A simple protection is a personal daily stop at roughly half the firm’s limit. If the firm allows 5%, stop at 2% to 2.5%.
8. Reward-to-Risk Versus Win Rate
The breakeven win rate for a given reward-to-risk ratio (R:R) is:
Breakeven win rate = 1 / (1 + R:R)
| R:R | Breakeven win rate |
|---|---|
| 1:1 | 50% |
| 1.5:1 | 40% |
| 2:1 | 33% |
| 3:1 | 25% |
Higher R:R lowers the win rate you need, but there’s a catch for challenges: low win rate strategies have longer losing streaks, and streaks are what threaten drawdown limits. A 30% win rate system at 3:1 can have losing streaks of 10 to 15 trades. Fine on a personal account with deep capital, brutal under a 10% drawdown limit.
For challenges, a balanced profile often works better: win rate around 45% to 60% with R:R between 1:1 and 2:1.
9. Costs: The Maths of the Challenge Fee
This is the part many traders ignore. The challenge fee is a cost of attempting, so the real question is your expected cost per funded account.
Cost per funded account = Fee ÷ Pass probability
Suppose a $100k challenge costs $500 [VERIFY, prices vary widely]:
| Pass probability | Expected spend to get funded |
|---|---|
| 5% | $10,000 |
| 10% | $5,000 |
| 25% | $2,000 |
| 50% | $1,000 |
| 88% | about $570 |
Industry-wide pass rates are commonly reported as low (often cited in the single digits to low teens) [VERIFY, no reliable official figure]. That means a trader with no verified edge is paying a lot for a lottery ticket. A trader with a proven edge and disciplined sizing can push their pass probability far above average, which makes the economics work.
Then consider the next step: after passing, you still need to generate payouts, and the firm’s profit split, payout rules and consistency rules matter. A challenge is worth buying only if the expected value after payouts is positive for you.
10. A Monte Carlo Approach (How to Test Your Own Odds)
Rather than guessing, simulate your strategy. This is the most useful practical tool in the whole article.
- Record at least 100 trades from your strategy (backtest or demo).
- Note your win rate, average win and average loss in R.
- Run a Monte Carlo simulation: randomly resample those trades thousands of times, apply the firm’s actual rules (target, daily loss, max drawdown, time limit), and count how often the run passes.
- Repeat with different risk-per-trade values to find the sweet spot.
You can do this in Python or even in a spreadsheet. The output is your estimated pass probability at each risk level, which is far more useful than a gut feeling. If the simulation says you pass 30% of the time, you know exactly what the attempt costs you.
11. A Practical Plan to Pass
Putting the maths into action:
- Prove your edge first. Trade the strategy on demo or small live size for 100+ trades. If expectancy is not clearly positive, don’t pay for a challenge.
- Simulate the challenge with your numbers and the firm’s exact rules.
- Risk 0.5% to 1% per trade. Never more than 1% unless your simulation justifies it.
- Set a personal daily stop at about half the firm’s daily loss limit.
- Don’t chase the target. If you’re up 6% after a week, you don’t need to risk more. Keep the same size.
- Cap open risk. Correlated trades (EUR/USD and GBP/USD, say) act like one bigger trade.
- Avoid high-impact news if your strategy isn’t built for it, since spreads and slippage distort the maths.
- Respect minimum trading days and consistency rules so you don’t pass the target and fail on a technicality.
- Journal every trade so you can tell variance apart from a broken strategy.
- Walk away after a breach. Don’t immediately buy a retry in frustration. Review the data first.
12. Common Mistakes (and the Maths Behind Each)
- Oversizing to “finish fast.” Doubling risk halves your room and sharply raises ruin probability.
- Revenge trading after a loss. It breaks your edge assumption, so your expectancy no longer applies.
- Ignoring spreads and commissions. A 0.1R cost per trade can turn a +0.10R strategy into zero.
- Using too few trades to judge a system. A 60% win rate over 20 trades is statistically meaningless.
- Overlooking equity-based drawdown. Floating losses count even if you never close the trade.
FAQ
What is the best risk per trade for a prop firm challenge?
For most traders, 0.5% to 1%. It balances survival against the time needed to reach the target.
What win rate do I need to pass?
There’s no single number. It depends on your R:R. With 1:1 payoffs you need clearly above 50%. With 2:1 you can pass with roughly 40% or more, as long as you size for losing streaks.
Can I pass with a 30-day time limit?
Yes, but you need enough trades to reach the target at a safe risk level. If your strategy produces only a handful of trades per month, the time limit is your real constraint.
Is it better to take a one-phase or two-phase challenge?
Two-phase programs usually have lower targets per phase but require you to pass twice, so the combined probability is the product of the two. One-phase programs often have stricter rules elsewhere. Run the numbers for each.
Are prop firm challenges worth the fee?
Only if your verified edge gives a high enough pass probability and payout terms that the expected value is positive. Use the cost-per-funded-account formula above.
Conclusion
Passing a prop firm challenge is less about finding a magic strategy and more about respecting the maths:
- You need positive expectancy, proven over enough trades.
- You must size positions so losing streaks don’t breach your limits.
- You should simulate your pass probability and calculate your cost per funded account.
- Discipline beats speed. Lower risk with patience usually wins.
If the numbers show you have an edge, a challenge can be a smart way to access larger capital. If they don’t, the best move is to improve the strategy before paying a fee.
Disclaimer: This article is for educational purposes only and is not financial advice. Trading involves substantial risk, and many traders lose money. Verify each firm’s current rules before purchasing a challenge.
[…] Also read: How to Pass a Prop Firm Challenge […]